Projects
I welcome new ideas, projects, and collaborations. If you have any questions or find something interesting, feel free to contact me here.
I am in the process of writing articles to accompany my python scripts, so please check back periodically as I catch up.
Table of Contents
- Back to the Basics: The Liquid Diffusivity Equation
- Calculus: Manually Programming Numerical Integration
- DCA: Optimizing Hyperbolic Decline Models
- Data Viz: Animating US State Population Evolution
- Net Cash Flow Model for Production Sharing Contracts (PSCs)
- Reservoir Engr: DAK Z-Factor Correlation for Real Gases
- Reservoir Engr: Pressure Derivative Computations for Well Testing Analysis
- Root Finding: Bisection Method
- World Population Plotter
Back to the Basics: The Liquid Diffusivity Equation July 2020
Foundation of fluid flow physics.
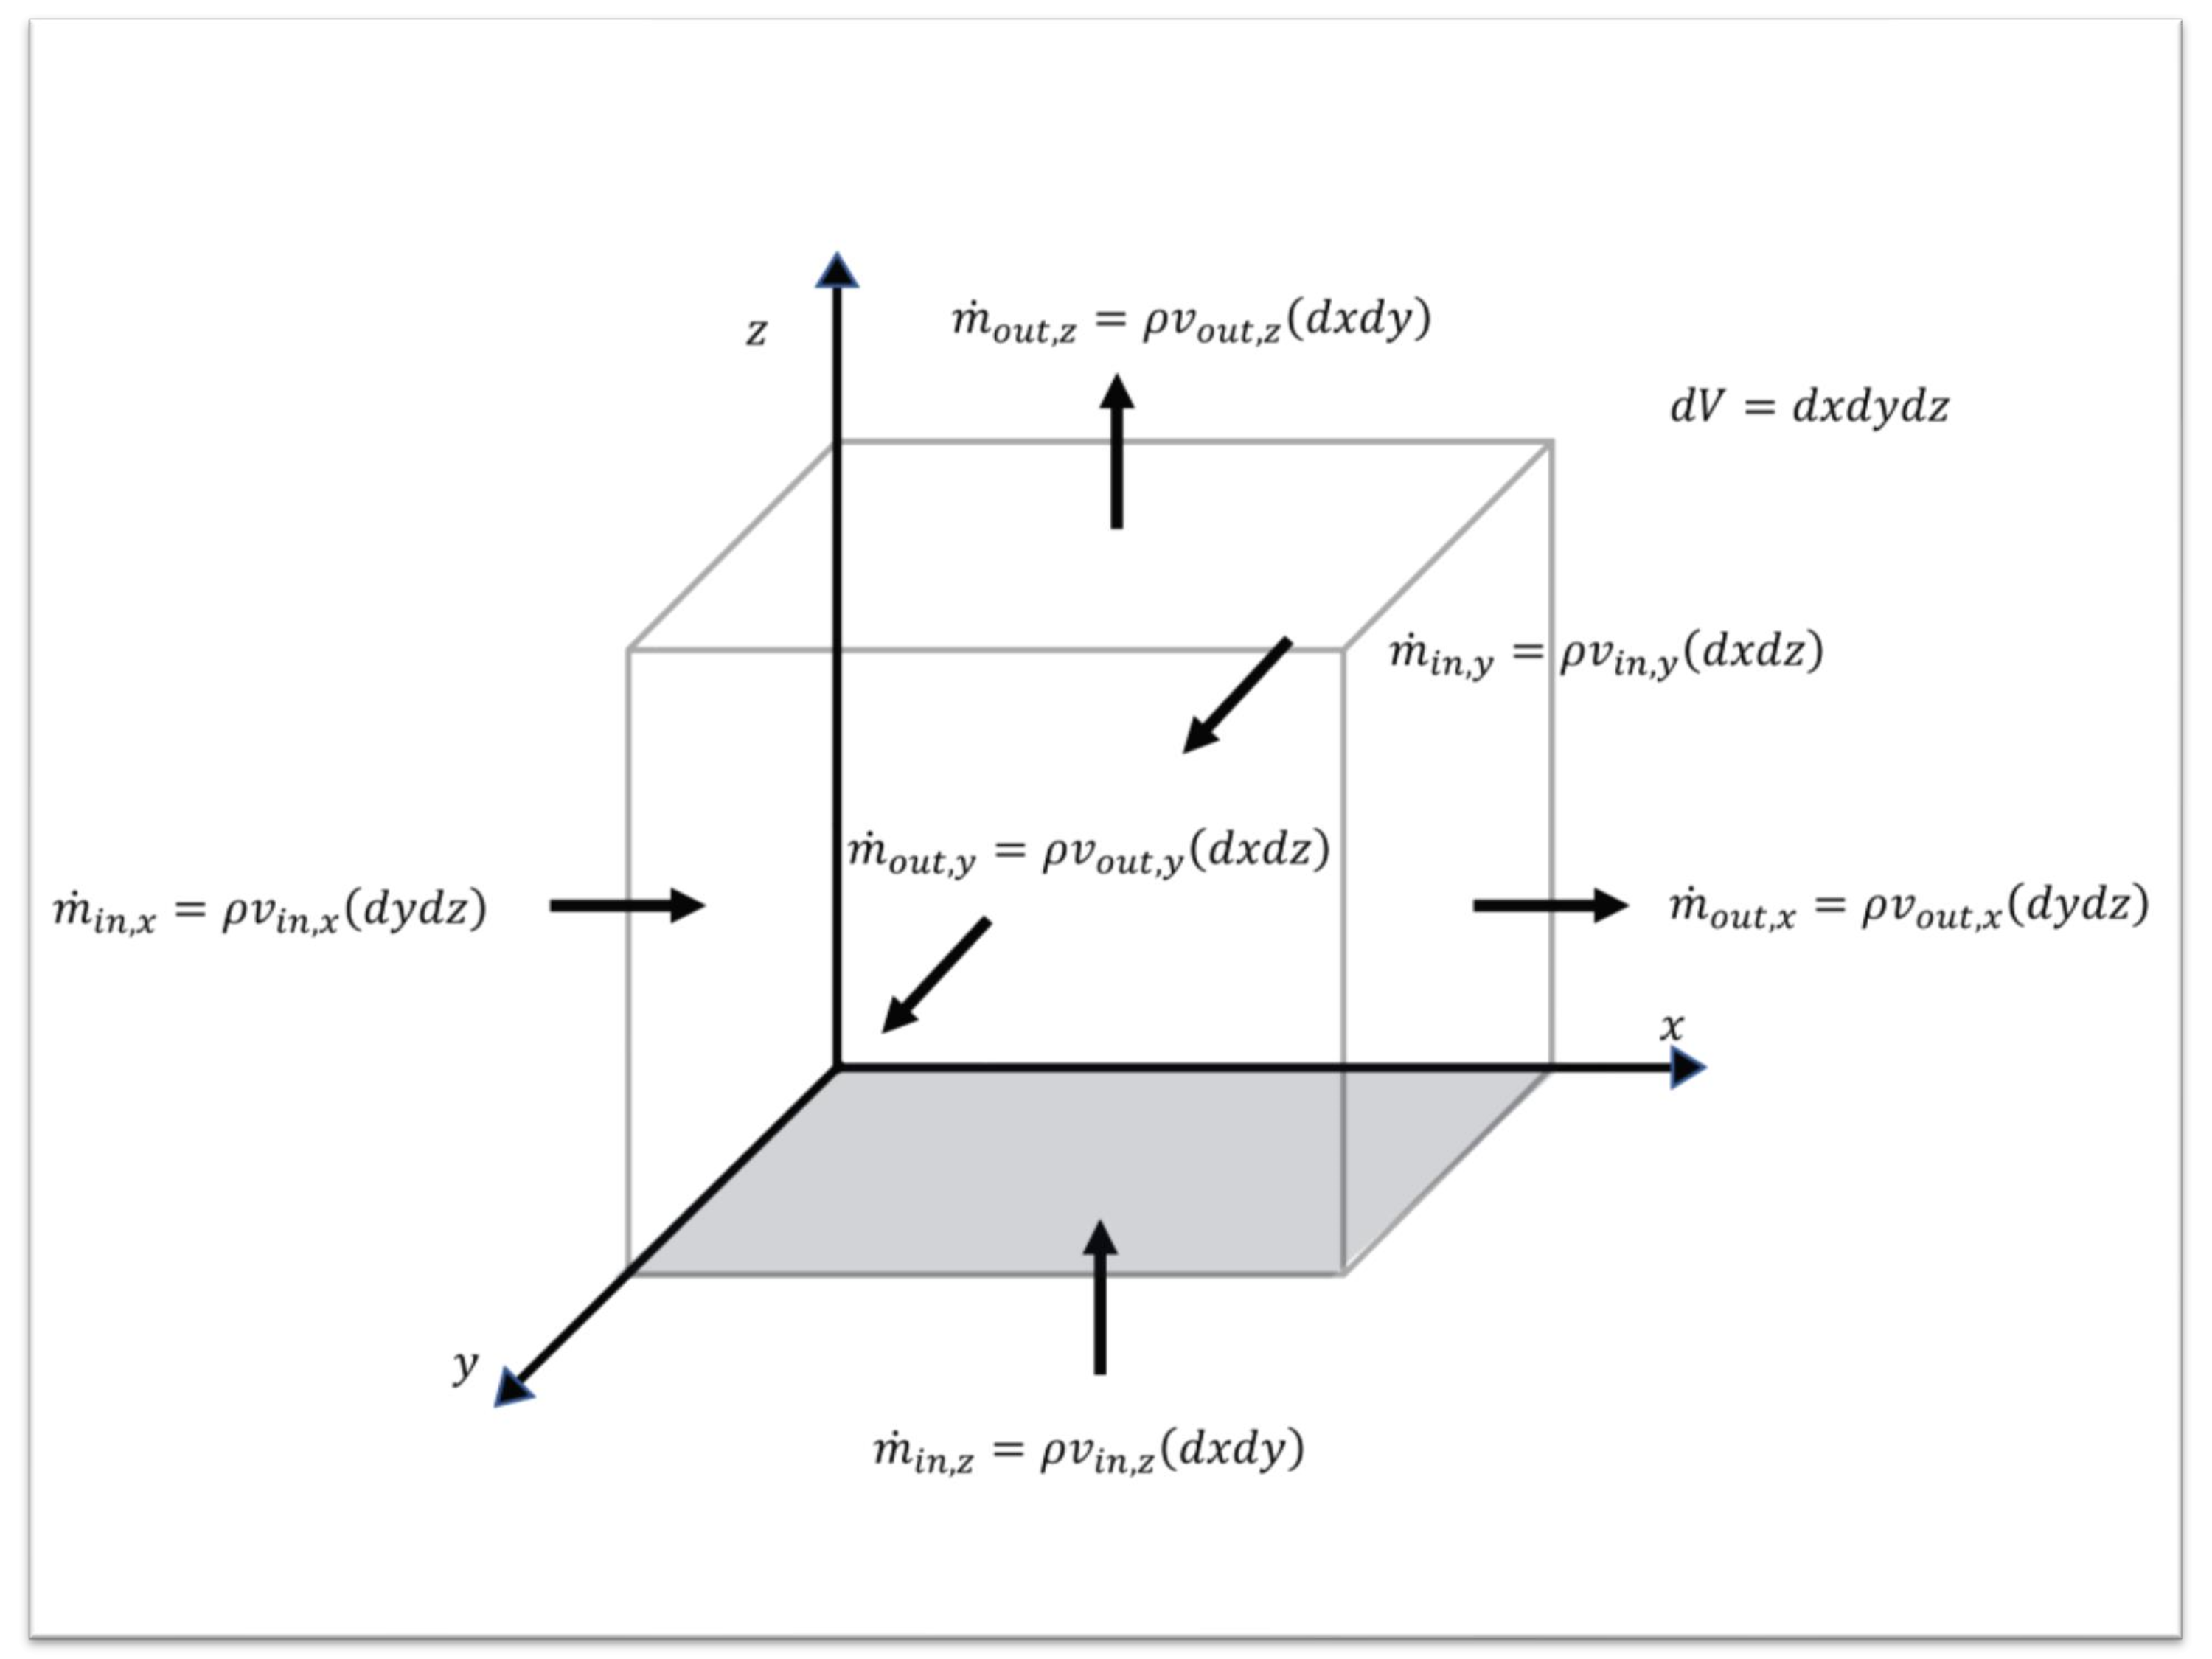
Sure, oil price is important. However, first you have to produce it from 1000s of feet below surface. This article extensively explains how the following three equations form the fundamental expression that governs the physics of liquid fluid flow through porous media:
- Mass continuity equation
- Equation of motion
- Equation of state
Links: Article
Net Cash Flow Model for Production Sharing Contracts (PSCs) August 2021
Understanding what it takes to generate cash flow.
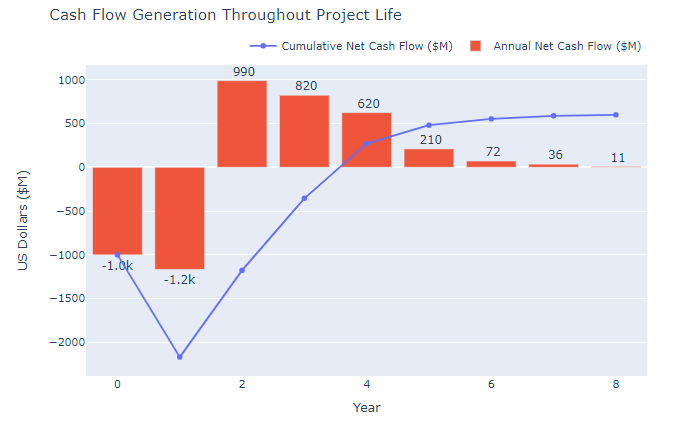
Generating a reliable, accurate cash flow model is paramount in any business. In Oil and Gas, this becomes even more important when there can be various investments, royalties, and production changes throughout the life of a well. This adapted jupyter notebook outlines an 8-year hypothetical project with two investment timings along with straight-line depreciation. Plotly Graph Objects are then used to do general visualization work.
Links: Article
Root Finding: Bisection Method August 2021
Visualizing iterations required for bisection algorithm.
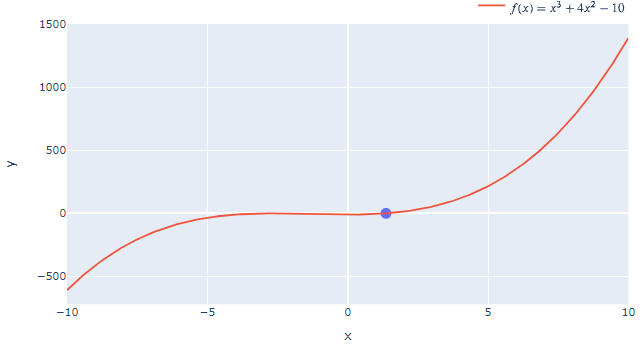
In practical scenarios where functions may be very complex, analytically solving for a root value is not feasible, or at the very least, very computationally exhaustive. In these cases, numerical methods can be useful. Bisection algorithm is one of the most general methods for root finding, but as the Jupyter notebook shows, there may be trouble converging on a root at later iteration levels.
Links: Article
DCA: Optimizing Hyperbolic Decline Models August 2021
Leveraging Scipy.Optimize to Perform Hyperbolic DCA.
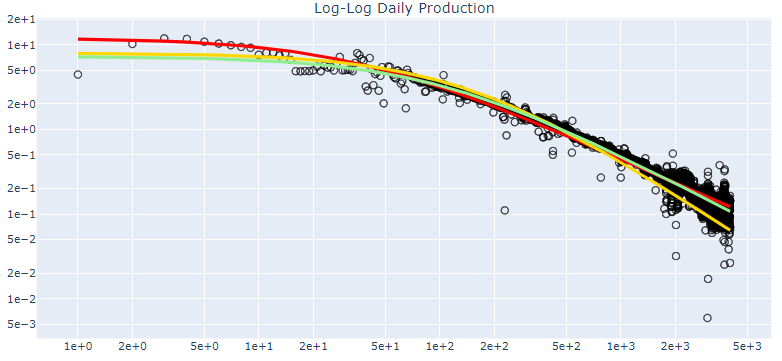
One of the main decline curve models still being used by petroleum engineers dates back to 1945. The man who published the earliest papers related to this was J.J. Arps. In this article, global minimization algorithms provided from Scipy.Optimize are used to best define a hyperbolic decline model.
Links: Article
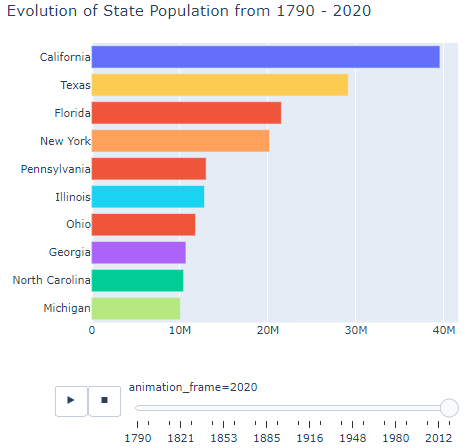
Data Viz: Animating US State Population Evolution August 2021
Leveraging animated graphics for evolutionary changes.
When dealing with large data sets, looking at the full range of data may not be appropriate for analysis purposes. Additionally, we may not be primarily interested in absolute values throughout time, but rather, in the changes realized at each time step. In this project, we look at US state population evolution based on US Census data dating back to 1790. Let's see what the path was that lead to California, Texas, and Florida to be the most populous states in the US (as of 2020).
Links: Article
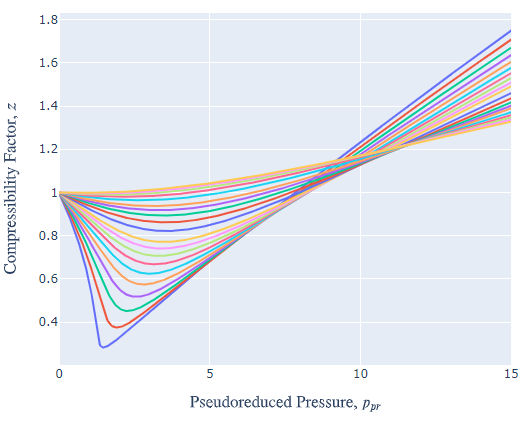
Reservoir Engr: DAK Z-Factor Correlation for Real Gases August 2021
Automating z-factor (compressibility factor) computations.
When petroleum engineers work with hydrocarbons that produce associated gas, many of the models require an equation of state (EOS) that is more complex than the traditional ideal gas law. To implement the real gas EOS, an important component is the gas compressibility factor ("z-factor"). Here we will program our own z-factor correlation that can be used in reservoir engineering problems and simulations.
Links: Article
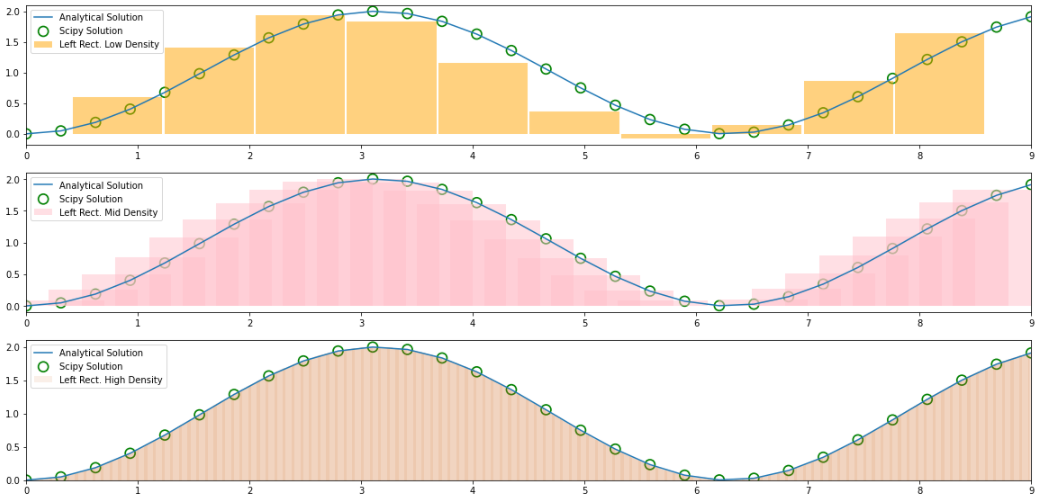
Calculus: Manually Programming Numerical Integration August 2021
How a rectangle can solve calculus problems.
When working with complex functions, computing the integral of a function is difficult. Therefore, using the concept of area under a function, the rectangular approximation to an integral is developed in this notebook. Additionally, an analysis of the accuracy of these numerical methods are evaluated by varying the number of rectangular panels.
Links: Article
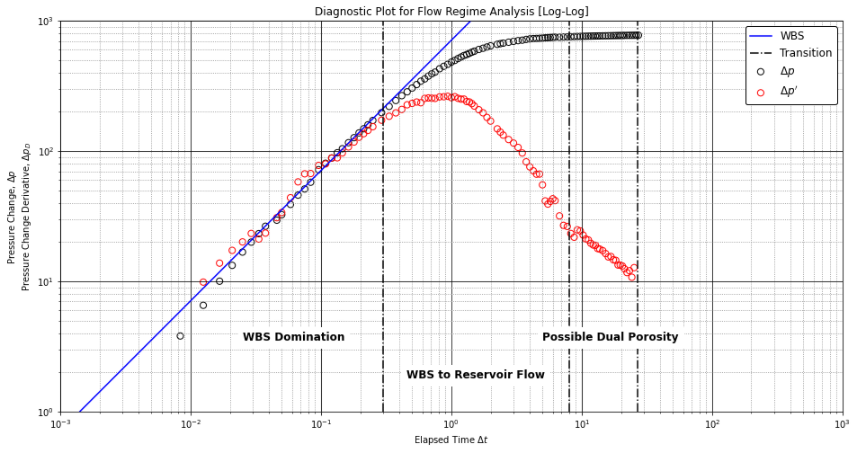
Reservoir Engr: Pressure Derivative Computations for Well Testing Analysis August 2021
The imperative step in analyzing flow regimes for well testing.
SPE-12777, by Bourdet et al., is a monumental SPE article that aided in the revolution of well testing. Realizing that analysis of the pressure derivative is able to identify certain flow regimes, it is important that this data be clear and easy to interpret. Using the Bourdet 3-point derivative algorithm, a well testing derivative will be developed.
Links: Article
World Population Plotter March 2022
Leveraging animated graphics for evolutionary changes.
When dealing with large data sets, looking at the full range of data may not be appropriate for analysis purposes. Additionally, we may not be primarily interested in absolute values throughout time, but rather, in the changes realized at each time step. In this project, we look at US state population evolution based on US Census data dating back to 1790. Let's see what the path was that lead to California, Texas, and Florida to be the most populous states in the US (as of 2020).
Links: Article
